

Mathematics

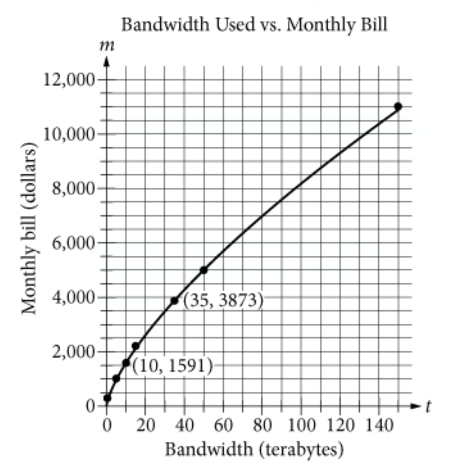
The graph at left models the monthly bill, m, in dollars, that a particular video hosting company charges a customer who uses t terabytes of bandwidth. What is the best interpretation of the average rate of change between 10 and 35 terabytes in this context?
解析: