

Mathematics>Standard Multiple Choice
Read the following SAT test question and then click on a button to select your answer.
![]()

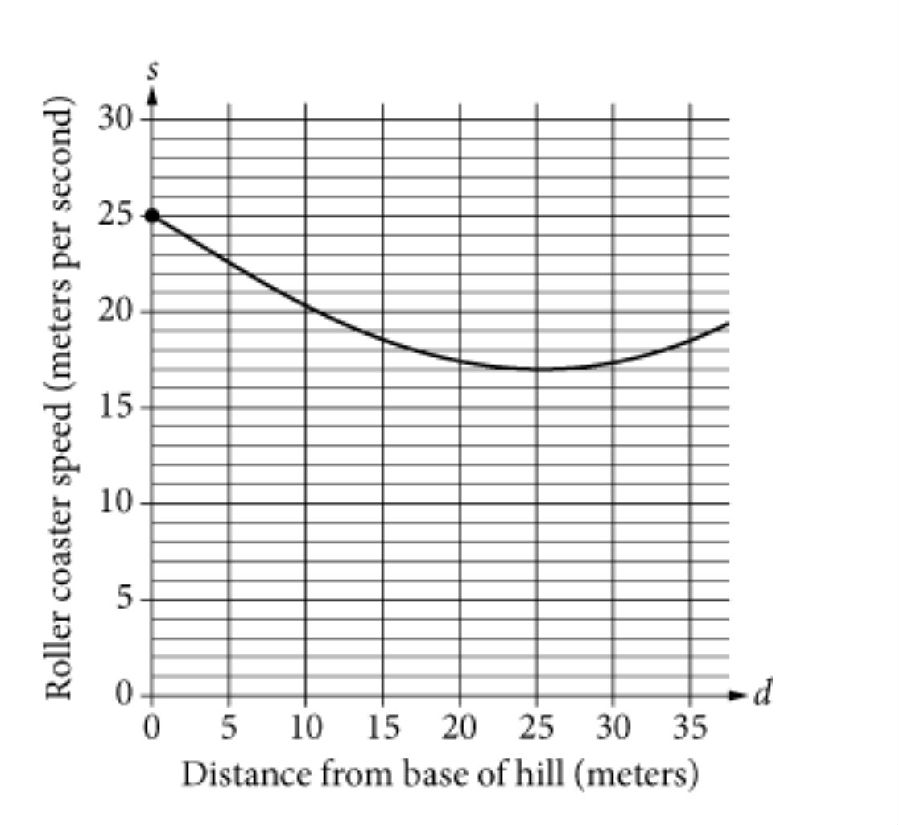
Engineers at a theme park are recording the speed of a roller coaster as it travels over a particular hill. The graph shown above in the ds-plane represents the relationship between s, the speed of the roller coaster, in meters per second, and d, the distance along the track from the base of the hill, in meters. What is the best interpretation of the s-intercept marked on the graph?
解析: