

Mathematics>Standard Multiple Choice
Read the following SAT test question and then click on a button to select your answer.

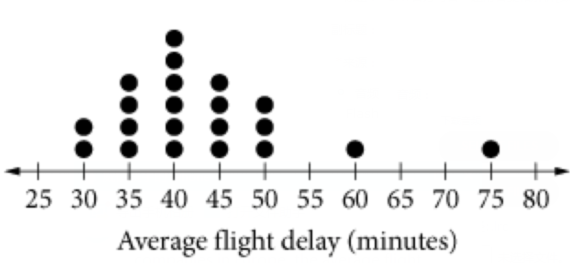
For each of the largest 21 airline companies in Europe, the average flight delay was calculated and is shown in the dot plot above. If the dots representing the two airlines with the longest average flight delays are removed from the dot plot, what will happen to the mean, median, and range of the new data set?
解析: